The Speed-Revenue Connection
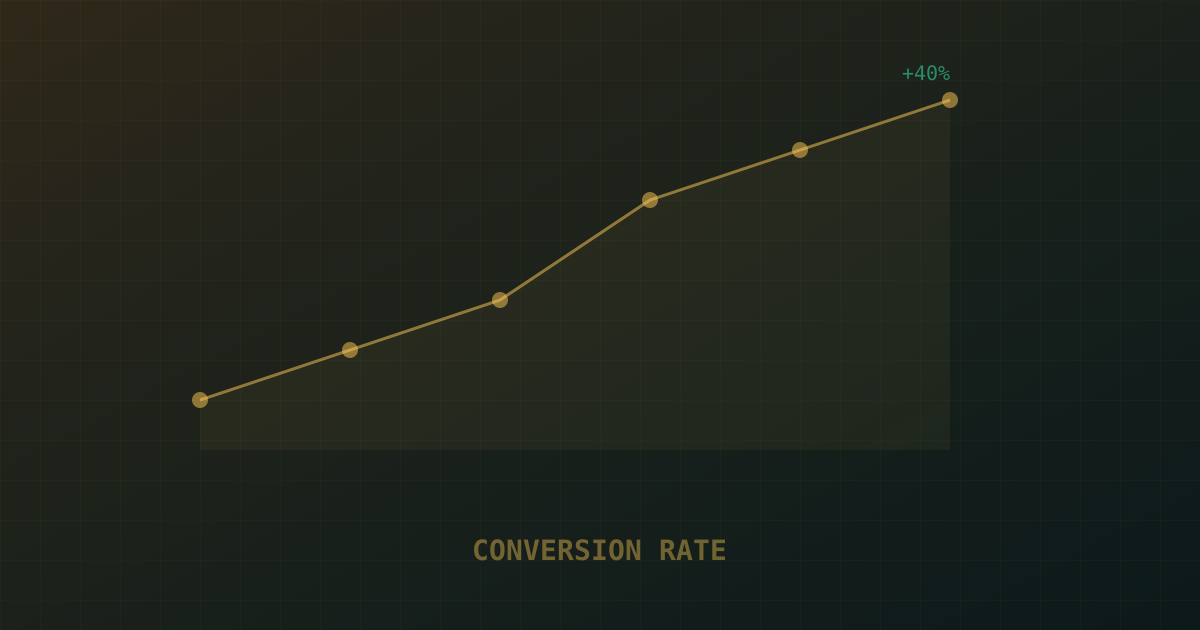
The correlation between page speed and conversion rate is well-documented. Amazon reported that every 100ms of additional load time costs 1% of sales. Walmart observed a 2% conversion increase for every 1 second of improvement. These aren't linear relationships — they're exponential at the tail end. A page that loads in 4 seconds converts dramatically worse than one loading in 2 seconds, not marginally worse.
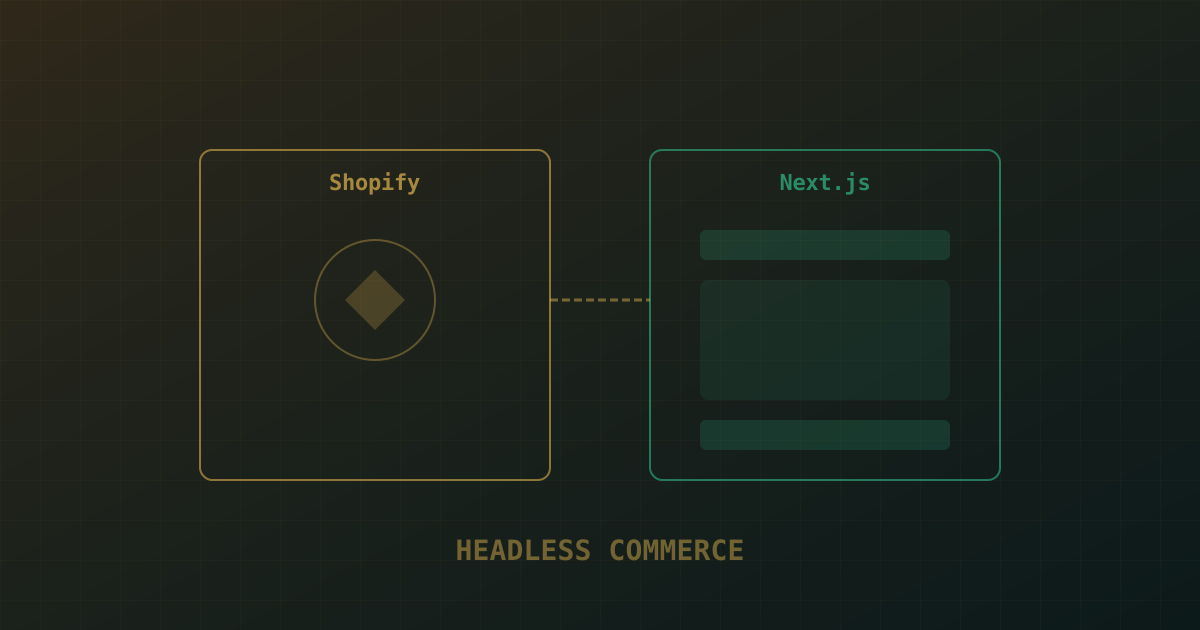
For e-commerce, the critical pages are product listing pages (PLPs), product detail pages (PDPs), and the checkout flow. Each has different performance characteristics and optimization strategies. This is a core part of the e-commerce development work we do for growth-stage retailers.
SSR for E-commerce
Server-side rendering is particularly valuable for e-commerce because product pages are content-heavy and SEO-critical. A server-rendered product page delivers complete HTML on the first request — search engines can index it immediately, and users see content before JavaScript loads. Next.js App Router with generateStaticParams and ISR (Incremental Static Regeneration) is the current gold standard: product pages are statically generated at build time and revalidated when products change.
The key insight: not every page needs the same rendering strategy. PLPs benefit from static generation with ISR. PDPs benefit from static generation with on-demand revalidation. The cart and checkout need client-side rendering for interactivity. Next.js lets you choose the rendering strategy per route.
Edge Caching Strategies
Edge caching serves pre-rendered pages from CDN nodes closest to the user, eliminating server round-trips entirely. For e-commerce, the challenge is personalization — cached pages can't include user-specific content (cart count, pricing, recommendations). The solution: edge-side composition. The page shell (header, navigation, product content) is cached at the edge. Personalized components (cart, recommendations, pricing) are fetched client-side or via edge functions after the initial page load.
We measure this as Time to First Byte (TTFB) for the cached shell and Time to Interactive (TTI) for the complete personalized experience. Cached TTFB should be under 50ms globally. TTI under 2 seconds on 4G connections.
Image Optimization Pipeline
Product images are typically 60–80% of an e-commerce page's total weight. An unoptimized product gallery can easily be 5MB. The optimization pipeline: serve WebP/AVIF formats with JPEG fallbacks, use responsive images with srcset for different viewport sizes, lazy-load below-the-fold images, and set explicit dimensions to prevent layout shift. Shopify's CDN, Cloudinary, and imgix all provide on-the-fly image transformation via URL parameters.
The single highest-impact optimization: set explicit width and height attributes on all product images. This eliminates Cumulative Layout Shift (CLS) — the most impactful Core Web Vital for conversion. Pages with CLS under 0.1 convert measurably better than pages with CLS over 0.25.
Core Web Vitals Optimization
Google's Core Web Vitals (LCP, INP, CLS) are ranking factors and conversion drivers. Largest Contentful Paint (LCP) should be under 2.5 seconds — optimize by preloading the hero image, minimizing render-blocking resources, and using server-side rendering. Interaction to Next Paint (INP) should be under 200ms — optimize by breaking up long JavaScript tasks and deferring non-critical work. CLS should be under 0.1 — optimize by setting explicit dimensions on all media and reserving space for dynamically-loaded content.
Measuring Impact
Measure performance impact on conversion using Real User Monitoring (RUM) — not lab tests. Lab tests (Lighthouse) measure performance on a specific device and connection. RUM measures actual user experience across all devices and connections. We segment RUM data by performance quartile and correlate with conversion rate. The difference between the fastest quartile and slowest quartile typically shows a 20–40% conversion rate gap. This is the business case for performance investment — and the reason teams bring in specialized Next.js developers for storefront rebuilds rather than treating it as a routine frontend refresh.